Economic and environmental right-sizing of battery-electric haulage fleets in open-pit mines
Kenta Matsui1,2, Jose Escribano-Macias1, Panagiotis Angeloudis1
Abstract
We size battery-electric haul truck fleets for open-pit mines with a mixed-integer linear program over an extended state network that tracks each truck's load and battery charge, and includes production targets, charger capacity and traffic congestion at intersections. For each truck class and battery capacity, the model finds the cheapest fleet and its flows, then evaluates CO2e against a diesel baseline. On three synthetic mine maps, ignoring charging or congestion underestimates fleet cost. The cheapest design isn't always the cleanest, either. Against diesel, battery-electric fleets cut operational CO2e by about 62% at a grid factor of 0.25 kgCO2e/kWh, for a small cost premium.
Method
With autonomous haulage, adding a truck no longer adds a driver, so the cost of a larger fleet of smaller trucks falls. That moves the trade-offs to charging and congestion, and it means truck class, fleet size, battery capacity and charger power have to be chosen together.
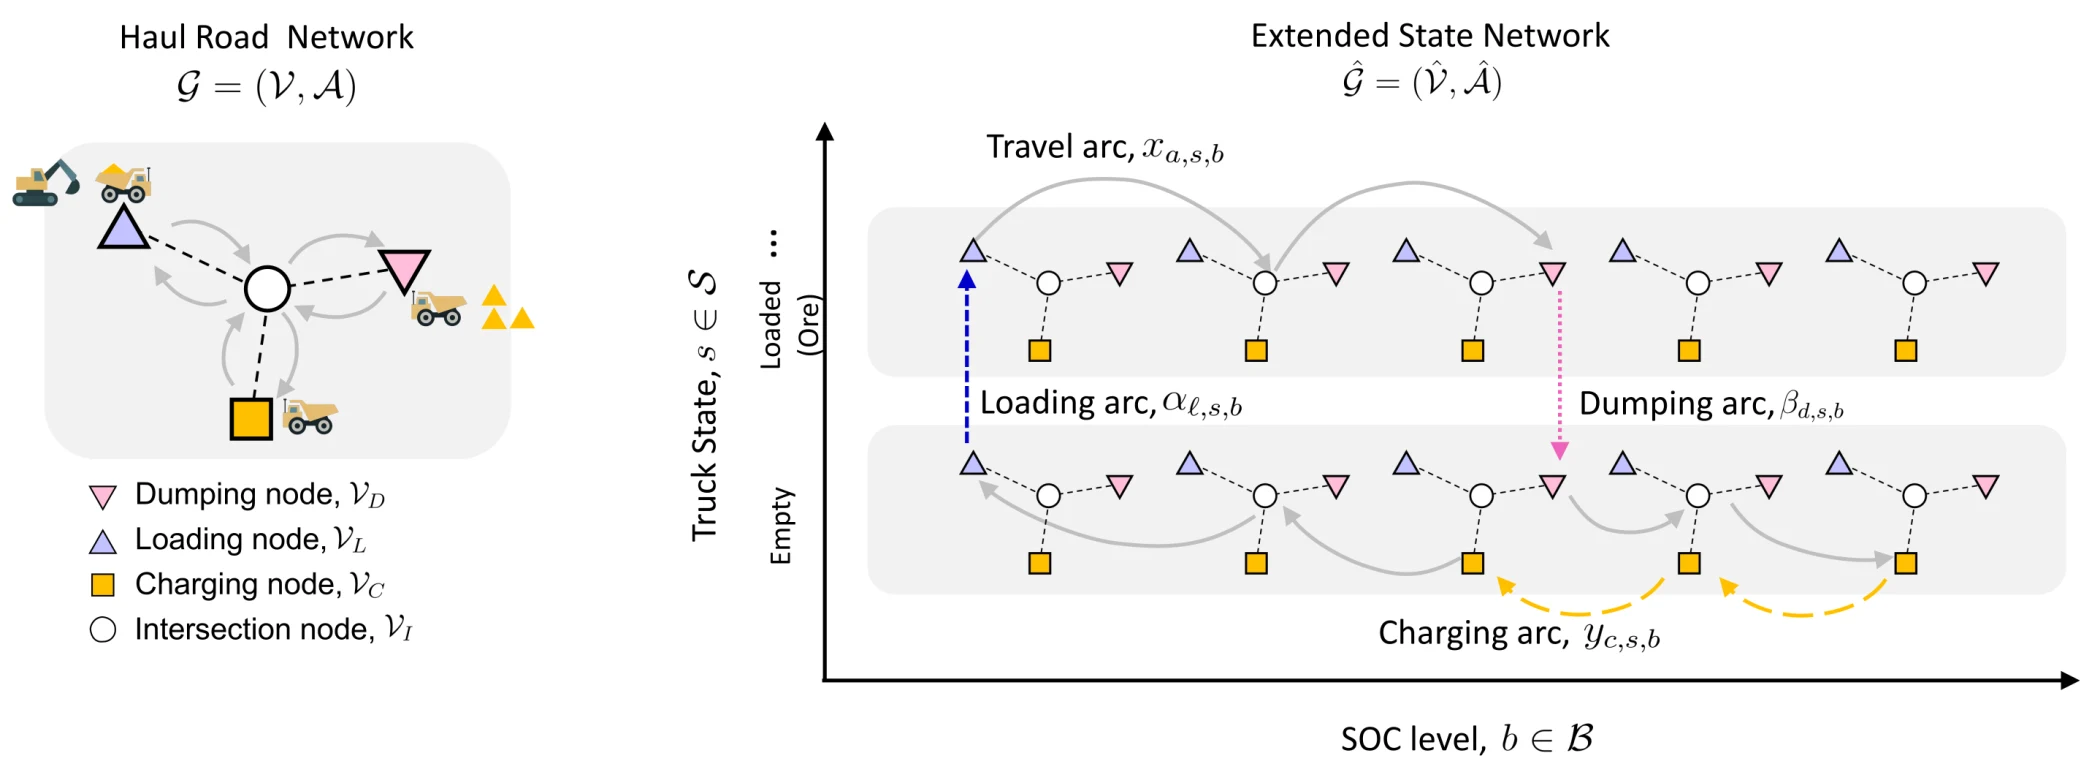
The model copies the haul-road network once for each load state (empty, or loaded with a material) and each battery charge level, in 10 kWh steps. Truck flows move through this extended network on four kinds of arc: travel, loading, dumping and charging. Travel arcs use energy that depends on grade, rolling resistance and the truck's total mass, battery included; charging arcs restore it at a rate set by charger power. The model finds the steady-state flows that meet the production target at least hourly cost, and the fleet size follows from Little's law: flow multiplied by the time spent driving, waiting at intersections, queueing at shovels and dumps, and charging.
Intersection delay grows with the number of trucks crossing, using delay curves calibrated by Bayesian inference on intersection simulations for each truck class. Shovels and dumps are modelled as M/G/c queues. Truck class and battery capacity are design inputs: the model is solved for each combination, and the cheapest feasible design is selected. Operational CO2e, battery embodied emissions and installed battery and charging capacity are then computed from each optimised design.
Mathematical formulation
The decision variables are steady-state flows in trucks per hour: on haul-road arc in load state , leaving at charge level ; loading and dumping flows and for material ; and charging flows , each of which raises a truck's charge by one 10 kWh step at station . Travelling arc uses steps. For a given truck class (payload ) and battery capacity , the model minimises hourly cost, energy plus a per-truck cost for operation, battery and truck capital:
Flow is conserved at every node, load state and charge level. Loading turns empty flow into loaded flow, dumping turns it back, and charging moves a truck up one level:
Dumped tonnage meets each material's production target, and chargers are capped at a share of their slots, counting charging time and a preparation time per visit:
Energy and fleet size follow from the flows. By Little's law the fleet is the number of trucks driving, waiting at intersections (delay rises with inflow ), loading and dumping (service plus M/G/c queueing) and charging:
| Symbol | Description |
|---|---|
| Sets and indices | |
| Sets of dumping, charging and intersection nodes, indexed by , and | |
| Arcs entering and leaving node | |
| Haul-road arc | |
| Load state (empty, or loaded with a material) and material type | |
| Discretised state-of-charge level, 0 to | |
| Decision variables (flows in trucks per hour) | |
| Travel flow on arc in state at charge level | |
| Loading flow at location and dumping flow at location , for material at charge level | |
| Charging flow at station in state at charge level | |
| Total inflow at intersection | |
| Total energy consumption and active fleet size | |
| Trucks loading, dumping and charging, including queueing at shovels and dumps | |
| Parameters | |
| Charge levels consumed on arc in state | |
| Energy consumption and free-flow travel time on arc in state | |
| Intersection delay at inflow (Davidson curve) | |
| Battery capacity (kWh) and charge-level width (target 10 kWh) | |
| Nameplate payload and effective carried payload | |
| Production target for material | |
| Maximum charger power and charging efficiency | |
| Chargers at station and charger utilisation cap | |
| Charging visits at station and per-visit preparation time | |
| Grid-side electricity price ($/kWh) | |
| Fleet operating cost ($/(veh·h)), battery cost ($/(kWh·h)) and truck capital cost ($/(t·h)) | |
Demo
Choose a mine, whether intersection congestion is modelled, and a truck class. The grid shows every battery capacity and charger power evaluated in the paper; select a cell to see that design's fleet, costs and traffic, next to a diesel fleet of the same class. The 576 battery-electric designs and 24 diesel fleets were solved in advance with the paper's model and base settings (60% production target, six chargers per station, electricity at $0.15/kWh, diesel at $1.00/L).
Design grid
Loading results…
Selected design
Traffic on the haul network
Where the trucks are
Trucks needed for each activity, from Little's law (flow multiplied by time spent). The total is rounded up to whole trucks.
Cost per tonne
CO2e per tonne
Operational emissions at the chosen grid emission factor (2.75 kgCO2e/L for diesel), plus battery manufacture at 80 kgCO2e/kWh amortised over 20,000 hours.
Results
- Congestion adds a smaller penalty than charging, but a systematic one. It's largest for small trucks, because their bigger fleets send more trucks through each intersection.
- At the 60% production target, the 300 t class is cheapest on the medium and large maps and the 180 t class on the small map. The 60 t class is never cheapest. The cost gap between classes widens as the mine gets bigger.
- No design is feasible at 1 MW. At 2 MW the small and medium maps become feasible; the large map needs 3 MW for most battery sizes. The cheapest designs on every map use 4 MW, but the model doesn't price chargers, so treat 4 MW as the best setting tested.
- Small battery packs need more charging stops and so more trucks, while large packs cost more and add mass. For the 300 t class, operational CO2e falls towards larger batteries, with shallow minima at 1.4–2.2 MWh.
- How much battery-electric haulage saves depends on the grid. Against diesel, the cut in operational CO2e is about 62% at 0.25 kgCO2e/kWh and 8–12% at 0.60, and it's gone above 0.653–0.685 kgCO2e/kWh.
Limitations
- Nothing is field-calibrated. The mine layouts and congestion curves are synthetic, and the diesel baseline comes from the same model.
- The model is steady state and counts only grade and rolling-resistance energy, so energy and cost per tonne are lower bounds.
- Emissions cover electricity, diesel fuel and battery manufacture, and the cost objective leaves out chargers and grid connection.
Citation
@article{matsui2026rightsizing,
  title   = {Economic and environmental right-sizing of battery-electric haulage fleets in open-pit mines},
  author  = {Matsui, Kenta and Escribano-Macias, Jose and Angeloudis, Panagiotis},
  journal = {Journal of Cleaner Production},
  volume  = {577},
  pages   = {149346},
  year    = {2026},
  doi     = {10.1016/j.jclepro.2026.149346}
}
Figures are reproduced from the paper, published open access under a CC BY 4.0 licence.